Listen to this article 9:36
Jump to a section
Read aloud by an AI voice (ElevenLabs) from the text on this page, which is the full transcript. Tables are summarized in the audio; see them below.
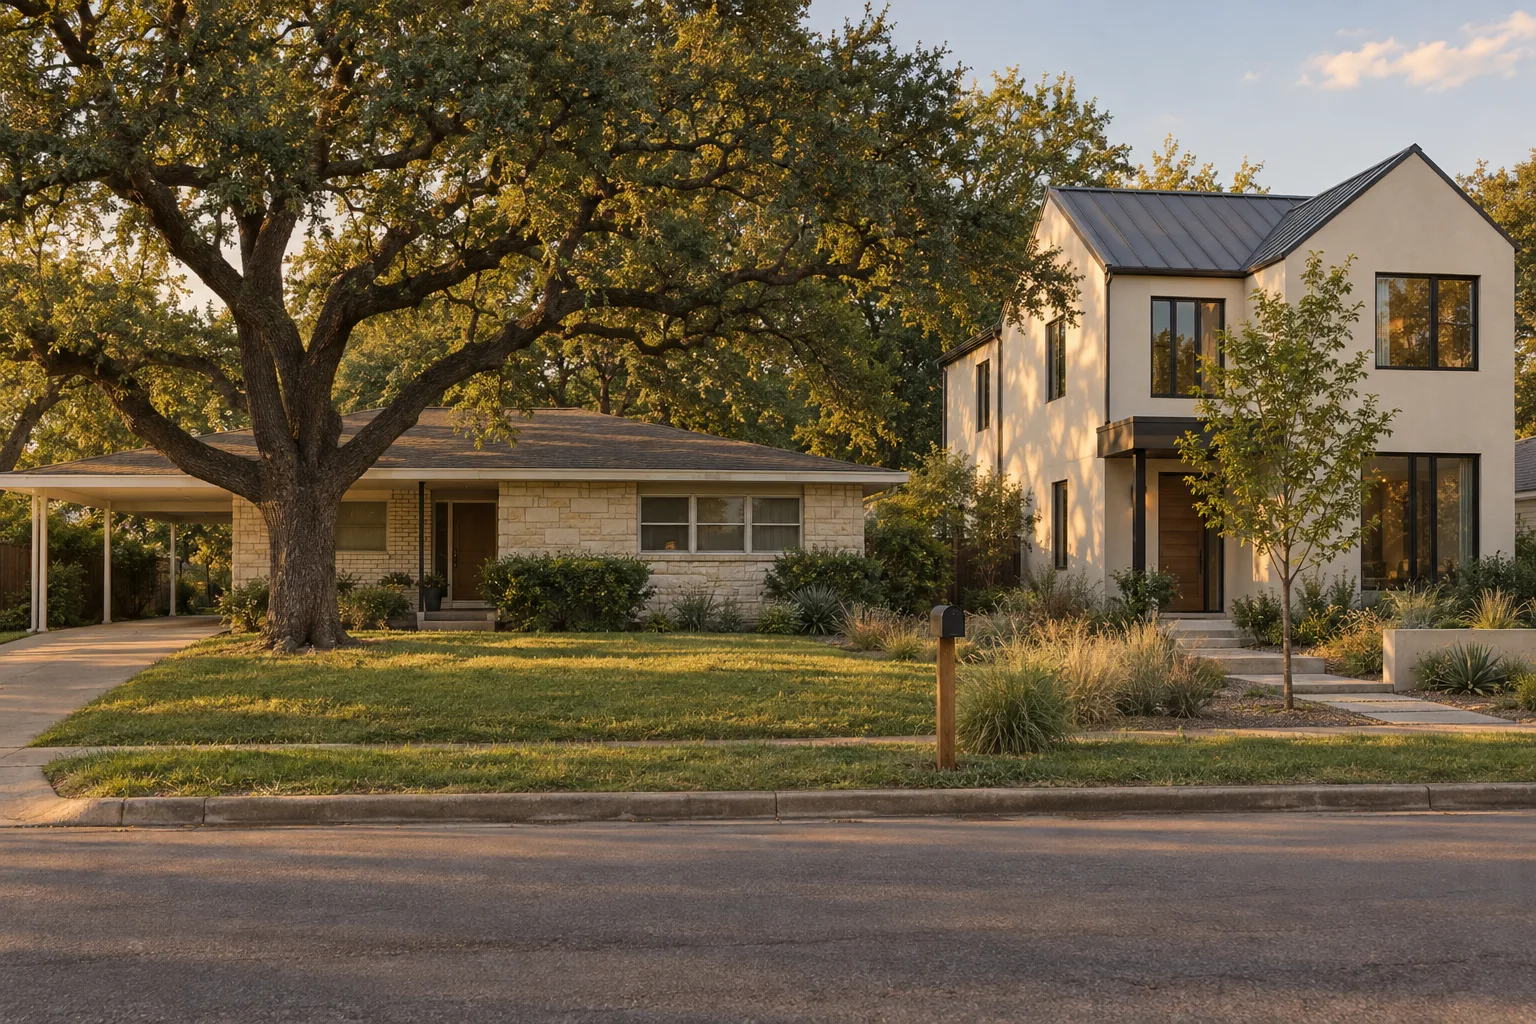
Drive Greenlawn Parkway or Shoalwood Avenue in Allandale and you see the same pairing every few lots: a one-story house from the Eisenhower years, then a two-story one with a metal roof that went up in the last five. The Travis Central Appraisal District's 2026 roll puts numbers on it. Allandale has 2,876 single-family houses, and 2,237 of them, 78%, were built between 1950 and 1969. Those 1950s houses have a median of 1,753 square feet of living area. The 207 houses built since 2020 have a median of 3,350, and 149 of them carry a pool on the appraisal record.
Same streets, roughly the same lots, nearly twice the house. If you are shopping, selling or renting in north central Austin, that gap shapes what is on the market and what happens to it after it sells. Here is what the public records show.
Which Allandale we counted
There is no legal boundary for a neighborhood in Austin. We used the City of Austin's planning-area map outline for Allandale, which runs from MoPac east to Burnet Road, north of 45th Street. It covers 3,201 appraisal parcels, most of them in ZIP 78757 (1,966), with 745 in 78731 and 466 in 78756. The streets with the most parcels are Shoal Creek Boulevard (220), Woodview Avenue (114), Bull Creek Road (112), Shoalwood Avenue (92) and Greenlawn Parkway (86). Our Allandale neighborhood page has the wider picture.
The housing stock, decade by decade
| Year built | Houses | Median living area | With a pool |
|---|---|---|---|
| 1927 to 1949 | 158 | 1,728 | 15 |
| 1950 to 1959 | 1,339 | 1,753 | 112 |
| 1960 to 1969 | 898 | 1,902 | 133 |
| 1970 to 1979 | 19 | 1,634 | 1 |
| 1980 to 1999 | 18 | 2,135 | 3 |
| 2000 to 2009 | 43 | 2,644 | 14 |
| 2010 to 2014 | 72 | 2,687 | 18 |
| 2015 to 2019 | 122 | 2,902 | 51 |
| 2020 to 2025 | 207 | 3,350 | 149 |
| All houses | 2,876 | 1,923 | 496 |
Three things stand out. First, almost nothing was built between 1970 and 1999; the neighborhood was full. Second, every rebuild era is bigger than the one before it. Third, the lots did not grow with the houses. The median parcel under a 1950s house is 0.24 acres, about 10,600 square feet; under a house built since 2020 it is 0.23 acres, about 10,100. The new houses are bigger because they go up, not out: 167 of the 207, or 81%, have two or more stories, while the 1950s houses average 1.06.
The middle half of the post-2020 houses runs from about 3,000 to 3,700 square feet. Only 131 of the 2,669 houses built before 2020 reach 3,000.
One out, one in: the permit record
City of Austin building permits show the turnover directly. We counted permits to demolish a one-family house and permits for a new single-family house, issued inside the same outline.
| Year | House demolitions | New houses |
|---|---|---|
| 2015 | 16 | 26 |
| 2016 | 14 | 20 |
| 2017 | 13 | 12 |
| 2018 | 18 | 22 |
| 2019 | 23 | 21 |
| 2020 | 30 | 26 |
| 2021 | 42 | 31 |
| 2022 | 33 | 36 |
| 2023 | 23 | 28 |
| 2024 | 27 | 28 |
| 2025 | 35 | 40 |
| 2026 (to Nov. 14) | 32 | 32 |
Since January 2020 the City has issued 222 house demolition permits and 221 new-house permits here, close to one for one. This year is already at 32 of each, ahead of the same point in 2025 (29 demolitions and 34 new houses by Nov. 14). The pace is about 1% of the housing stock a year. It is slow enough that a given block changes over a decade, not a season, and steady enough that most blocks have at least one new house on them already. Our citywide look at demolition permits covers the same records across Austin.
What the HOME rules changed, and what they didn't
Since Feb. 5, 2024, the City has accepted applications under the first phase of its HOME amendments, which "allow up to three housing units, including tiny homes," on lots zoned SF-1, SF-2 or SF-3. Citywide, the City reports 954 applications reviewed under Phase 1, 767 approved and 1,529 new units approved, with 9 projects using the preservation bonus that exempts a kept older house from the floor-area limit. That data was updated Nov. 4, 2026.
In Allandale, the rules have not changed the pattern much. Of 85 lots with a new-home permit applied for since Feb. 5, 2024 and issued by Nov. 14, 2026, 76 got one house. Nine show a second unit, either as a second permit on the lot or in the permit's own description, and where the description gives bedrooms, the pairing is a main house of four to six bedrooms with a one-bedroom unit or garage apartment. None shows three units.
Permit-level detail for any of these addresses, including the demolition that came first, is on Zabalist's permit records.
The creek, briefly
Shoal Creek runs north to south through the neighborhood. Of the 2,876 houses, 81 (2.8%) sit on a parcel whose center falls inside a FEMA special flood hazard area on FEMA's National Flood Hazard Layer as loaded in our research database; 2 of the 207 post-2020 houses do. That is a parcel-center test, not a survey, so for a specific house check the FEMA map and ask for an elevation certificate. Our piece on flood areas and the seller's notice explains what the seller must tell you.
What this means if you're buying, selling or renting here
Buying an original house. You are buying a 60- to 75-year-old house on a lot that builders also want, so you may be bidding against someone who plans to take it down. Ask for the permit history at the address, look for open or expired permits, and read the deed restrictions in the title commitment; some older subdivisions carry restrictions that are stricter than City zoning. Before you count on adding a second or third unit under HOME, have the City's zoning and the restrictions checked for that lot.
Buying a new one. A 3,350-square-foot house on a 10,000-square-foot lot leaves less yard, and nearly three in four new houses here have a pool. Check the final inspection on the house and the pool permits separately; our pool permit piece shows how often an older pool permit expired before it was finaled. The new house will also be appraised as a new house, so look up its value and exemptions on the Travis Central Appraisal District site before you estimate the tax bill.
Selling an original house. Your buyer pool may include builders as well as people who want to live in the house as it is. The two groups look at different things, the lot and the trees for one, the kitchen and the roof for the other. Know the lot size, the zoning and any protected trees before you list. Nobody can tell you which group will pay more on a given street, and we won't try.
Renting. The second units on those nine lots are small, garage apartments and one-bedroom units behind a large main house. Whether any is rented out is up to its owner, and there are few of them, so they will not add much to what is for rent here.
How we pulled this
We took the City of Austin's Allandale planning-area outline and selected Travis Central Appraisal District parcels whose center falls inside it, then joined each to the district's 2026 roll record for its main improvement. "Houses" are state code A1 one-family dwellings; townhomes, duplexes and condominiums are not counted. Year built and living area are the district's figures; a remodel may not change the year built. Permits come from the City's Issued Construction Permits records, selected by the permit's location inside the same outline, with void and withdrawn permits removed. The two-unit count reads both the number of permits on a lot and the permit description. Percentages, medians and sums are our arithmetic. This is general information, not advice about a particular property; for flood, title or tax questions, ask the agency or a licensed professional.
One next step
If you are weighing a house in Allandale, original or new, a local agent can pull the permits, the appraisal record and the flood map for that address before you make an offer. Start at our get started page.